

$Tick Index

Do you know about Tick Index?
A tick is the minimum movement either up or down of a security and A tick index compares the number of stocks that are rising to the number of stocks that are falling for a given exchange. A tick index gives traders a short term snapshot of market sentiment.
Let’s jump to the most popular tick index, the NYSE Tick. Market bias is considered to be neutral when the tick reading is close to the zero level. A positive tick count (green highlight) signals bullish sentiment and a negative tick count (red highlight) signals bearish sentiment. The higher or lower the Tick Index reading the stronger the sentiment.
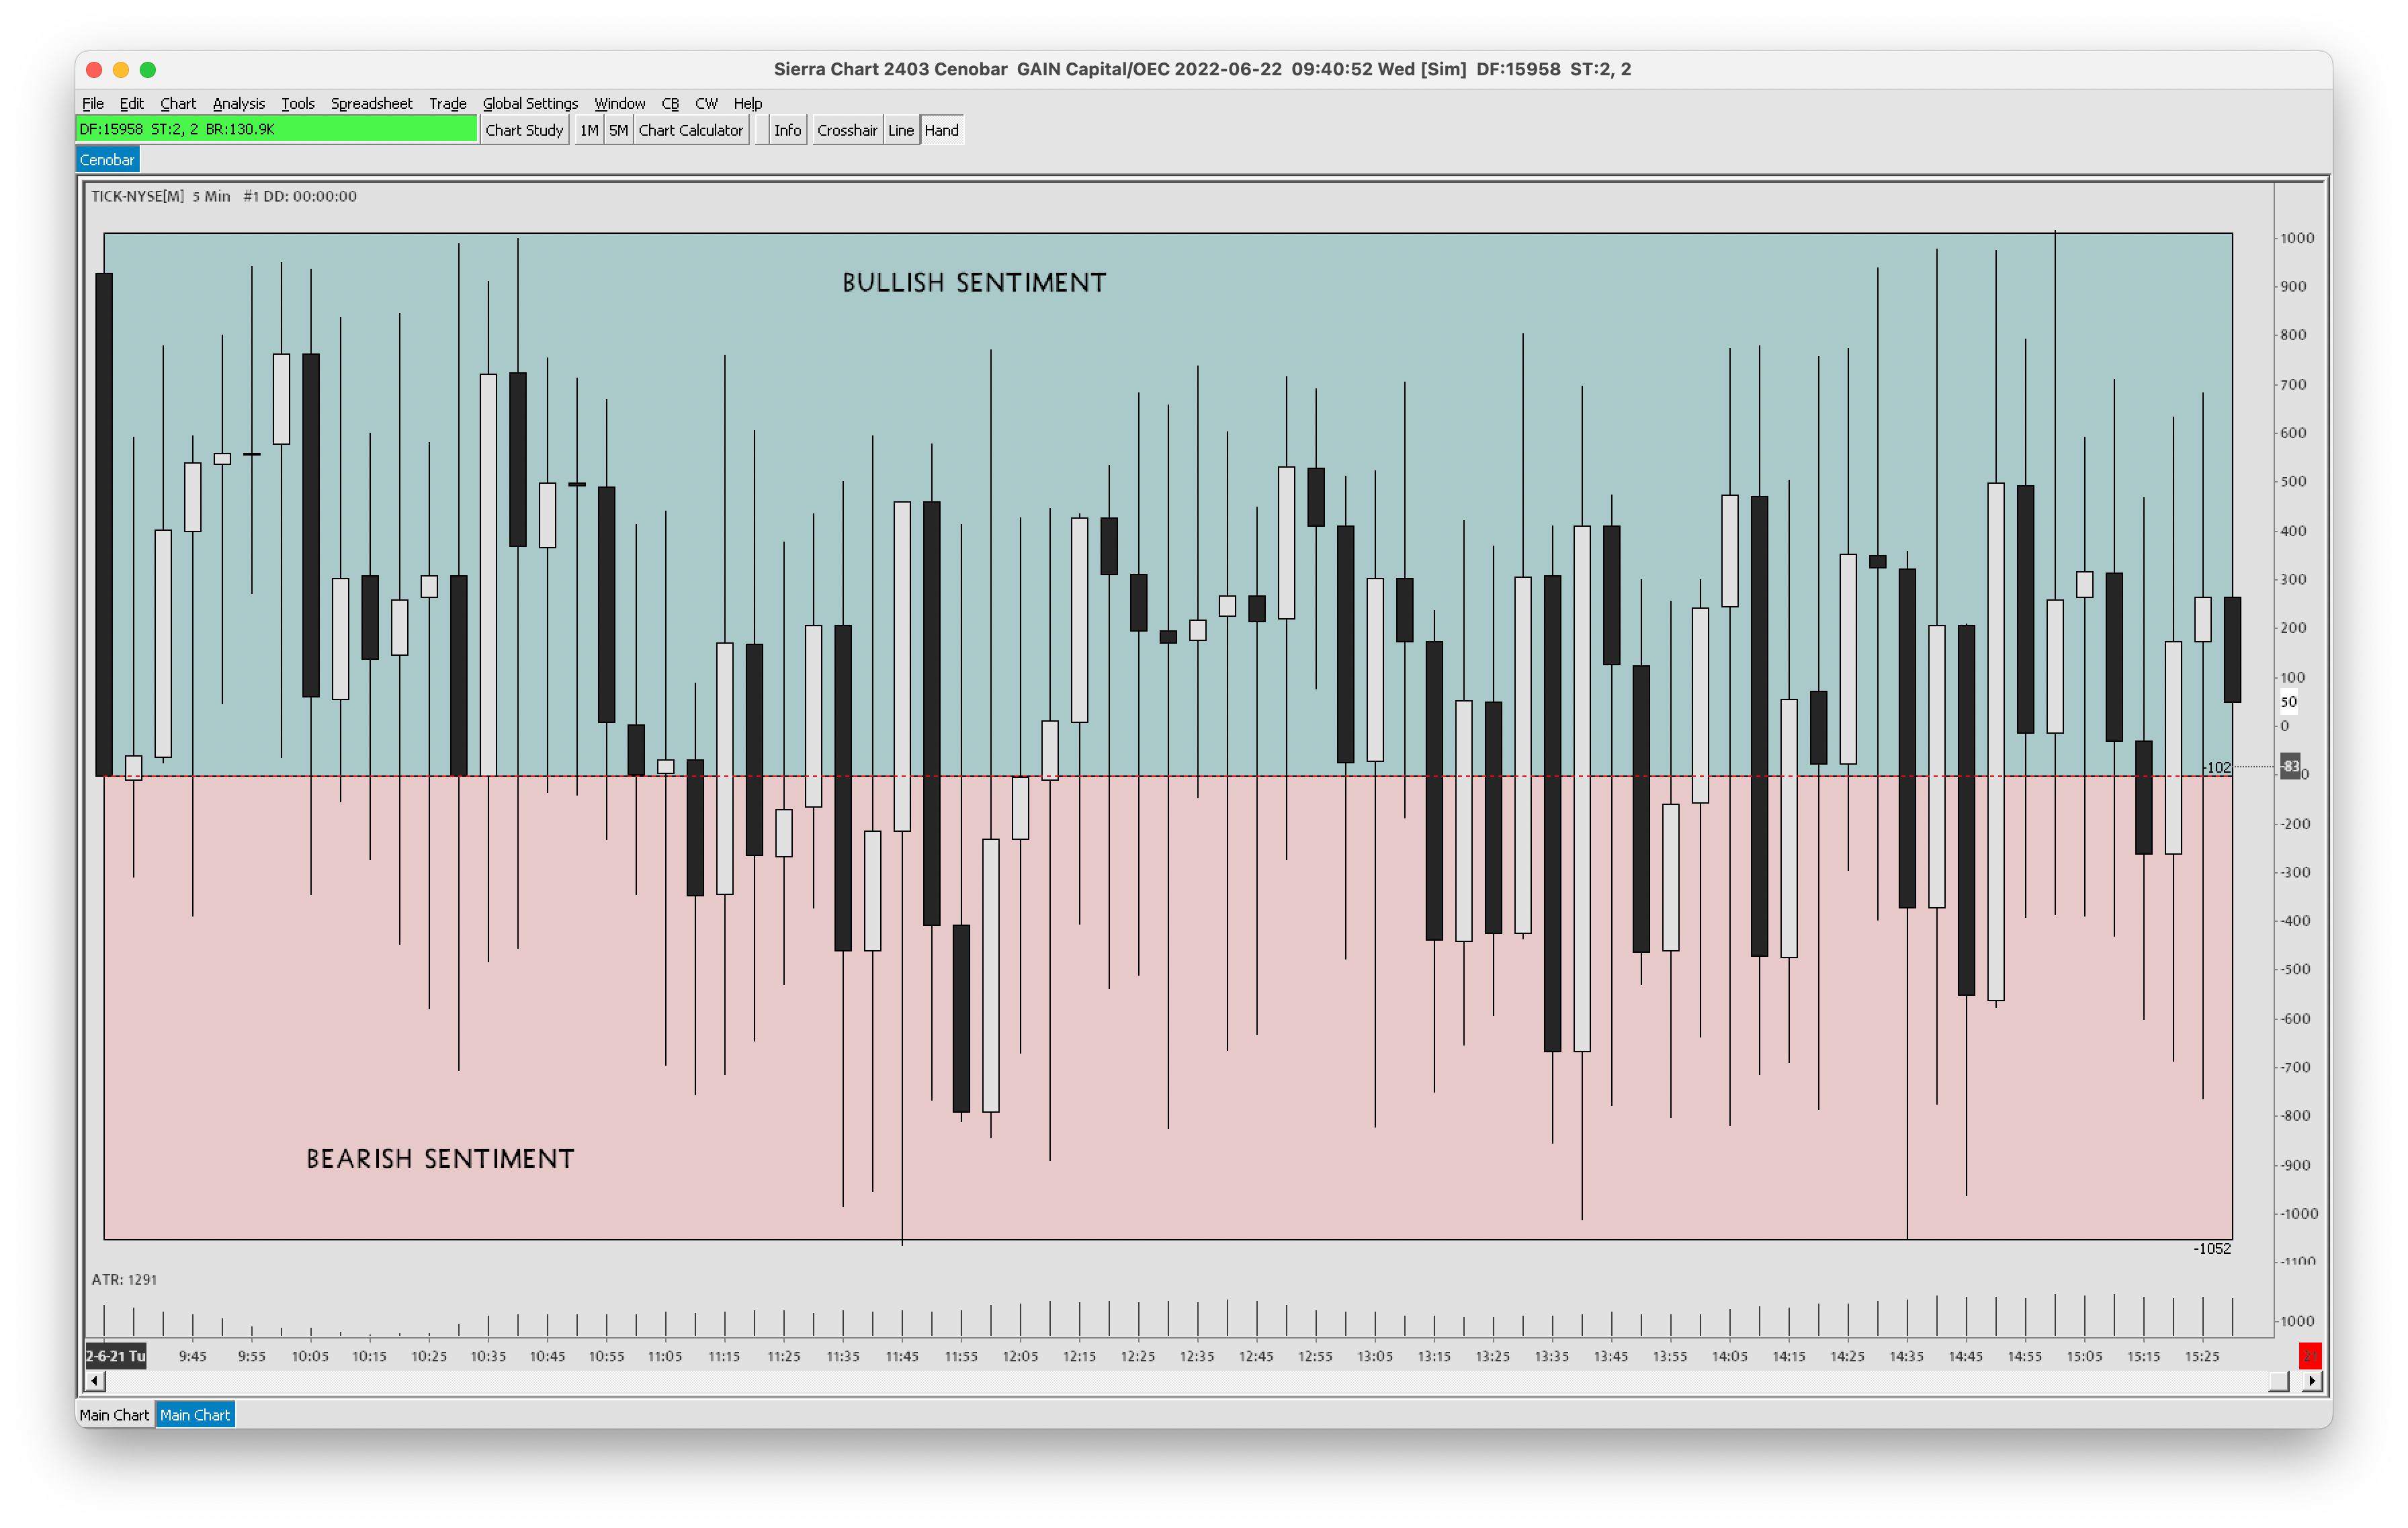
Ok, how to trade using the NYSE tick?
I have a little setup for this;
We can use NYSE tick as a divergence indicator.
Divergence is used to spot a potential trend reversal. When divergence occurs it’s a sign that momentum is slowing down and a potential reversal may be coming.
In this scenario; We have a bearish sentiment, also divergence between NYSE tick and $NQ index at same time.
